

Unlike other budgeting software programs that take months to implement, Dynamic Budgets can be setup and installed in 2 hours.
Dynamic Budgets is so intuitive that admins are usually comfortable with the system and ready to begin zero-based budgeting in as few as 5 hours.
To support employees working from remote locations, you can use Dynamic Budgets either hosted in the Microsoft Cloud or by VPN.
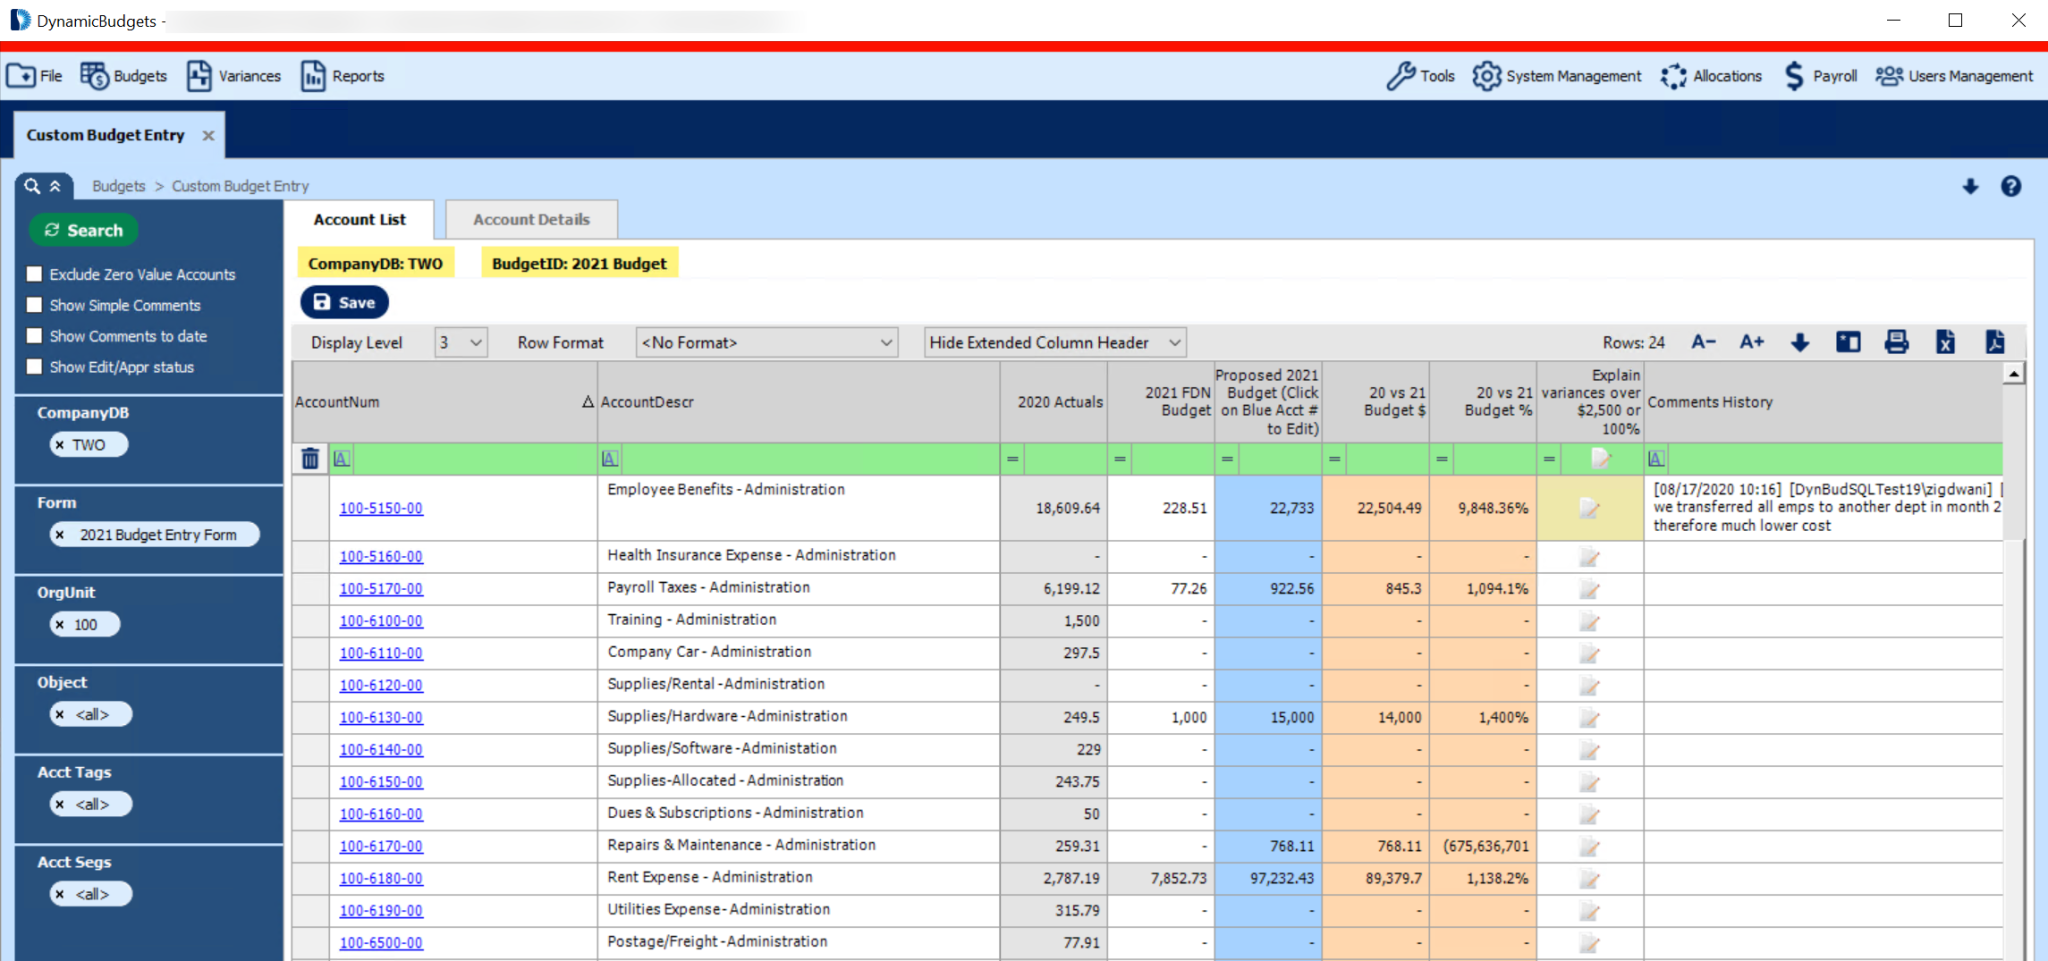
Get your entire organization on the same page by fostering multi-company and multi-department budgeting collaboration.
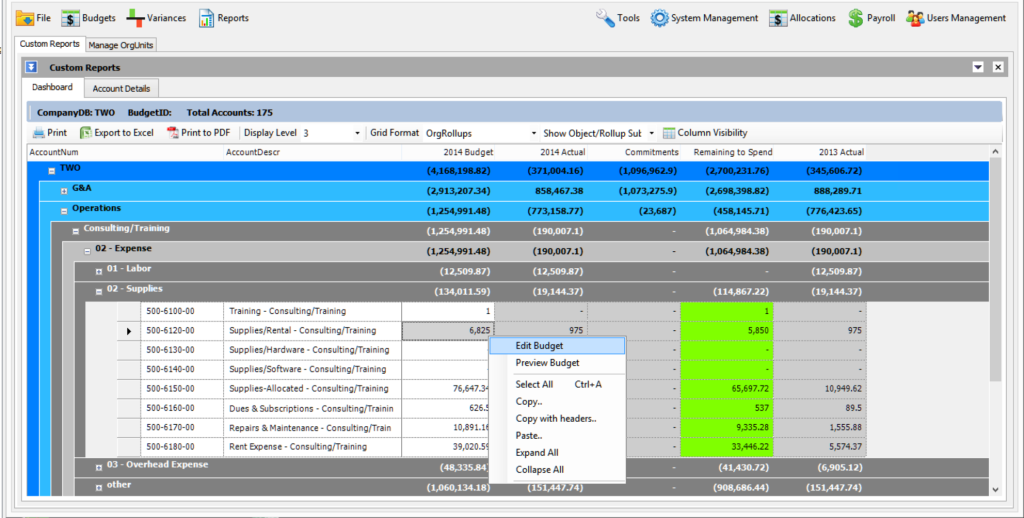
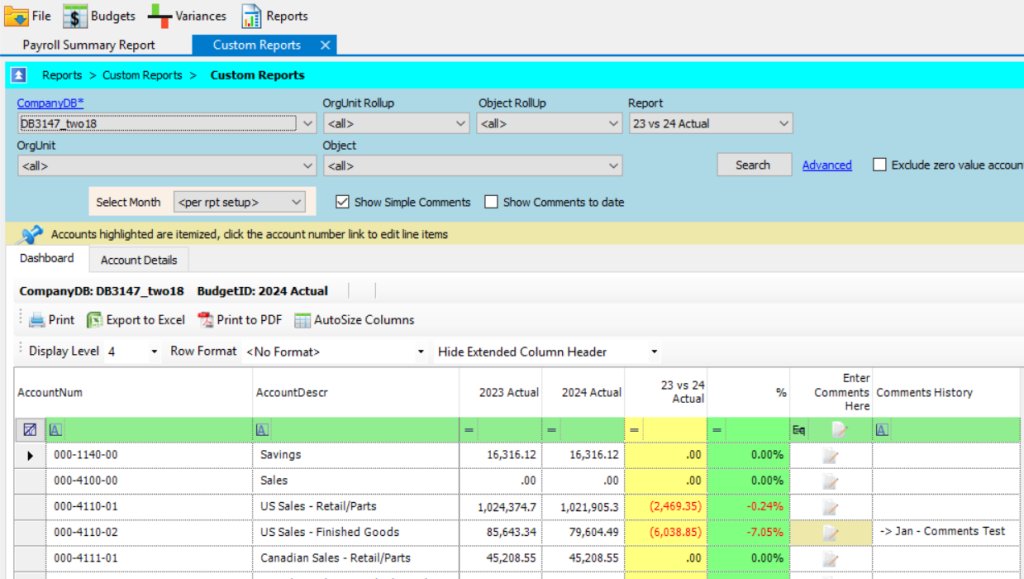
Dynamic Budgets is live linked to your ERP data, allowing users to drill down to discover deeper insights.
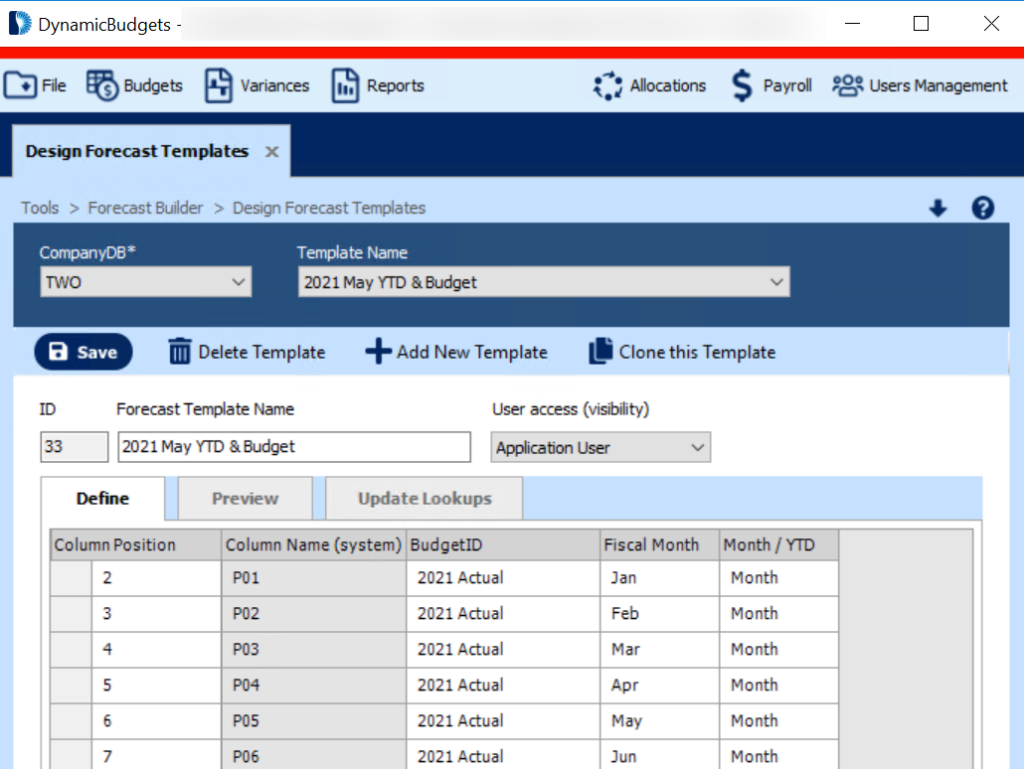
Our software development team uses your feedback to continually improve system performance and add new features.


